
For five years, price did the work in consumer goods. In Europe, food prices rose 38% between 2019 and 2025 while food-store sales volumes rose less than 2%. That model is running out of road, and revenue growth management has to be rebuilt to win volume back without giving the margin away.
Key takeaways
- EU food prices rose 38% from 2019 to 2025; volume in food-led retail rose 1.9%, and fell in Italy and Germany (Eurostat).
- PepsiCo's Q3 2026 growth split shows the turn: in North American beverages, pricing added 3 points and volume took 3 away.
- Private label now holds a 50% unit share across Europe's six largest grocery markets (Circana), while 34% of branded units sell on promotion.
The challenge: growth bought with price
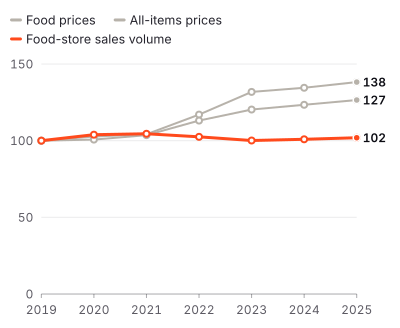
The numbers from Eurostat are stark. Rebased to 2019, the EU's food price index reached 138 in 2025, against 127 for all items. The sales volume of supermarkets and other food-led stores reached 102.
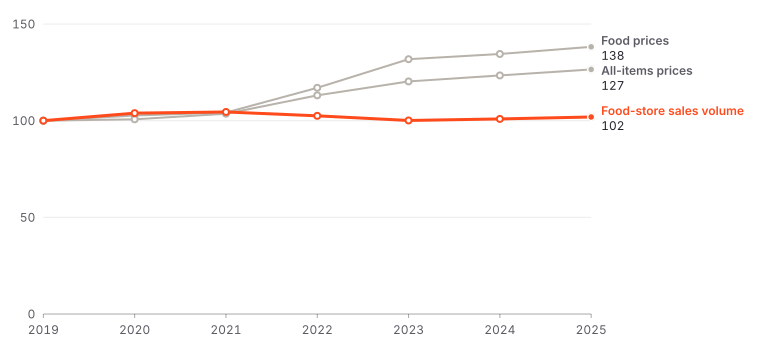
Food-store volume in 2025 was still 0.2% below 2019 in Germany and 2.8% below in Italy; France (+6.9%) and Spain (+7.4%) did better. Shoppers paid more and bought roughly the same amount. Many of them traded down: Circana reports that private label reached a 50% unit share across France, Germany, Italy, the Netherlands, Spain and the UK for the first time.
| Market | Units | Value |
|---|---|---|
| Spain | 59% | 52% |
| Netherlands | 56% | 55% |
| UK | 52% | 44% |
| Germany | 52% | 44% |
| France | 46% | 36% |
| Italy | 36% | 31% |
| Six markets | 50% | 42% |
Now the price lever is visibly weakening at the top of the industry. PepsiCo's third-quarter results on 8 October show organic revenue up 3.1%, with effective net pricing contributing 3 points and volume 0.5. The split by division is the real story.
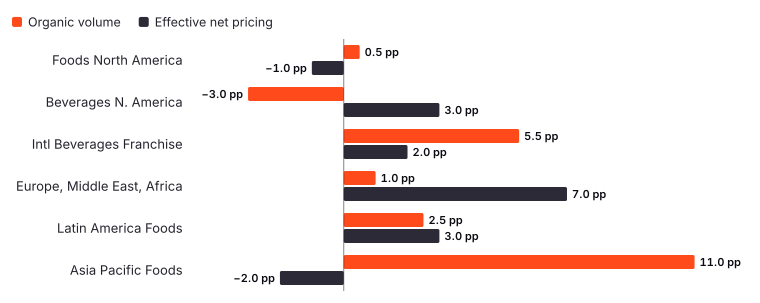
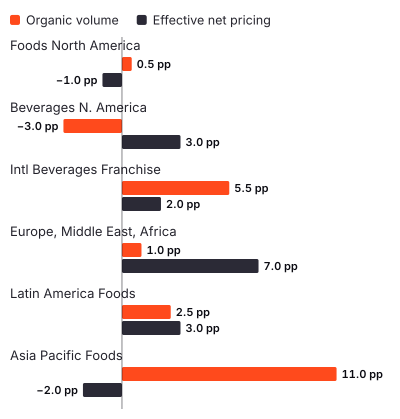
In North American beverages, pricing added 3 points and volume subtracted 3: organic revenue went nowhere. In North American foods, PepsiCo went the other way, investing in affordability. Pricing took 1 point off, volume and volume share improved, and core operating margin fell 280 basis points, which PepsiCo attributes to affordability investments, the lap of a prior-year asset-sale gain and higher marketing spend. The company has cut its core constant-currency EPS growth outlook for 2026 to 1–2%, from the low end of 4–6%.
Why the usual fix fails
The reflex is a deeper promotion. It rarely works. Brands already lean on promotion far more than retailers' own labels: Circana finds 34% of branded unit sales in those six markets were on promotion, against 14% for private label. Another round of depth buys short-term volume, trains shoppers to wait for the deal and hands margin to the retailer.
The second reflex, an across-the-board price cut, is worse. It gives money to shoppers who were not going to leave and does little for those who already have. Both fixes treat price as one lever. Revenue growth management (RGM) works because it treats price, pack, promotion, mix and trade terms as a system.
The resolution: five decisions
1. Put volume back on the scorecard
Report every brand's growth as a price, volume and mix bridge, by pack and channel, every month. Set volume and household-penetration targets alongside margin. Owner: CFO and head of RGM.
2. Rebuild the price-pack ladder around entry points
Affordability is a pack decision before it is a price decision. PepsiCo says its portion-control multipacks, now more than $3.5 billion in annual net revenue, delivered both volume and net revenue growth in the quarter. Map each category's ladder against private-label price points and fill the gaps with packs, not discounts. Owner: brand and RGM directors.
3. Move promotion money from depth to effectiveness
Score every promotion on incremental volume per euro of investment, then cut the bottom quartile and reinvest in the mechanics and stores that work. This is where AI earns its place: elasticity by store cluster, pack and week, read continuously rather than once a year. Owner: trade marketing.
4. Fund affordability with productivity, explicitly
PepsiCo says it has "elevated enterprise-wide productivity savings through automation, network optimization, digitalization and simplification" to support its growth priorities, and is adding structural cost reductions. Name the cost pool that pays for each price-pack move before you make it. Owner: CFO.
5. Tie trade terms to volume growth
Shift retailer investment from fixed allowances to pay-for-performance terms linked to distribution, display and unit growth. Owner: head of sales and key accounts.
Evidence: what the trade-off looks like
| PepsiCo Q3 | Vol. / price | Margin |
|---|---|---|
| N. America foods | +0.5 / −1 pp | −280 bp |
| N. America drinks | −3 / +3 pp | −15 bp |
| International | n/a | +105 bp |
Neither path is free. Price held beverage margin roughly flat (−15 bp) but lost 3 points of volume; affordability rebuilt volume in foods at a visible margin cost. The aim of the five decisions is to move the frontier: more volume per point of margin invested.
How to apply it
- Days 1–30: build the price, volume and mix bridge for your top ten brands over three years, by market. Identify where volume has fallen while price rose.
- Days 31–60: map price-pack ladders against private-label price points in your three largest markets. Rank promotions by incremental volume per euro.
- Days 61–90: launch two entry-pack moves and one promotion reallocation, each funded by a named productivity saving, with volume targets set in advance.
Pricing the shopper is off the table; we explain why in this week's article on AI dynamic pricing. Pricing the pack, the promotion and the trade term is where the volume is.